Gallery I
Figures from selected publications (2021-2024)
"Data visualization blends art and science to convey stories from data by graphical representations" (Nguyen et al., Vis. Comput. Ind. Biomed. Art 4, 27 (2021)). We pay great attention to covert complex data into appealing visual representations like graphs, charts, and images. Creating aesthetically pleasing and scientifically effective graphics is one of our major priorities. The gallery below displays some of our more recently published figures. All figures were created by Dr. Storz in Stata (StataCorp. 2025. Stata Statistical Software: Release 19. College Station, TX: StataCorp LLC.)


")
")


Gallery II
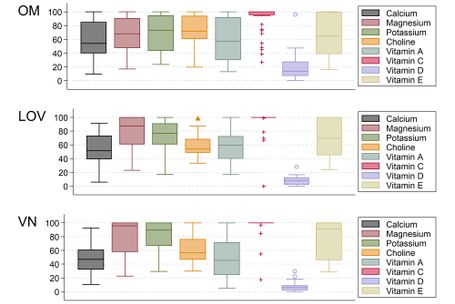
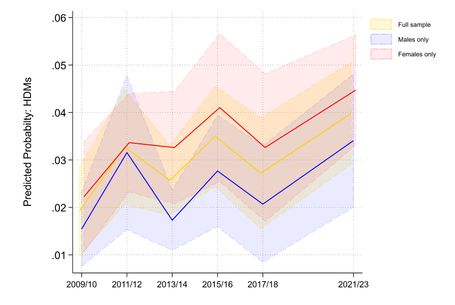
Figures from selected publications (2025)
The gallery below displays some of our most recently published figures. All figures were created by Dr. Storz in Stata (StataCorp. 2025. Stata Statistical Software: Release 19. College Station, TX: StataCorp LLC.). Dr. Storz always aims to expand his graphic portfolio by using state-of-the-art, user-written Stata packages such as "Combomarginsplot" (Nick Winter, 2014. "COMBOMARGINSPLOT: Stata module to combine the saved results from multiple calls to margins into one marginsplot," Statistical Software Components S457804, Boston College Department of Economics, revised 12 Nov 2021), "Coefplot" (Ben Jann, 2013. "COEFPLOT: Stata module to plot regression coefficients and other results," Statistical Software Components S457686, Boston College Department of Economics, revised 22 Aug 2025) or "Tabplot" (Nicholas J. Cox, 1999. "TABPLOT: Stata module to show table of frequencies as table of bars," Statistical Software Components S370601, Boston College Department of Economics, revised 09 Apr 2022).


Gallery III
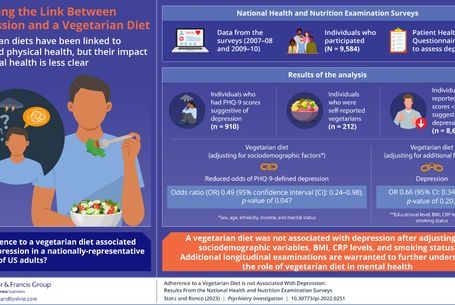
Infographics for selected projects
Selected infographics summaring our work in the field of vegetarian, vegan and plant-based nutrition. Dr. Storz owns the copyright for all displayed infographics. Please feel free to contact us directly in case of image reuse requests.